Maps coloured by your data, and every flag
Deckcell draws maps of the world, seven regions, any single country and the US states in PowerPoint and Google Slides. Colour them by value, by category or with your own colours, write values on them, and link them to Excel. A searchable gallery has 271 flags.
Last updated 24 October 2026
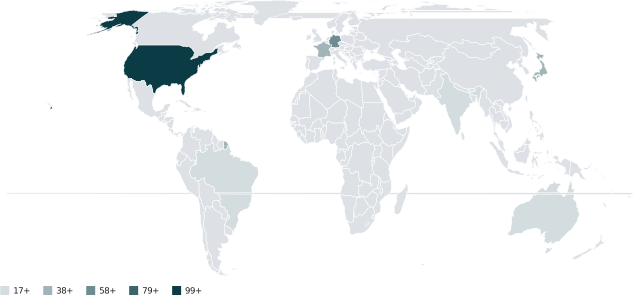
Maps
Views
World; Europe, Africa, Asia, Middle East, North America, Latin America and Oceania; any country; US states.
By value
Five shaded classes with a legend.
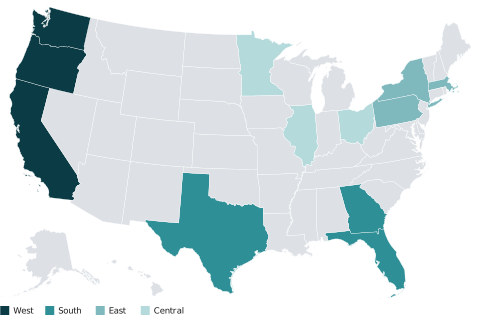
By category
A colour per region, segment or status.
Exact colours
Type a hex colour per country.
Labels
Write values on the map.
Matching
Countries by name, ISO code or number; states by name or postal code.
271 flags
Every country, plus the EU, the UN and a few regional groupings, searchable by name and inserted as pictures.
Frequently asked questions
Can I make a map chart in Google Slides?
Yes. Deckcell draws the same maps in Google Slides as in PowerPoint.
Where does the map data come from?
Country shapes are from Natural Earth (1:110m) and US states from the US Census Bureau, through the world-atlas and us-atlas packages.
Spend the evening on the story, not the formatting
Deckcell is in early access. Join the list and we’ll set you and your team up.
Join early access